Metrics & Funnel Attribution
B2B marketing leaders devote much time to developing, tracking and managing metrics. With long sales cycles and data-packed technology solutions, numbers, statistics, and facts are abundant. The challenge lies in how to use them properly, how to identify metrics that matter, and which marketing technology solution is best to generate, manage or report on the metrics.
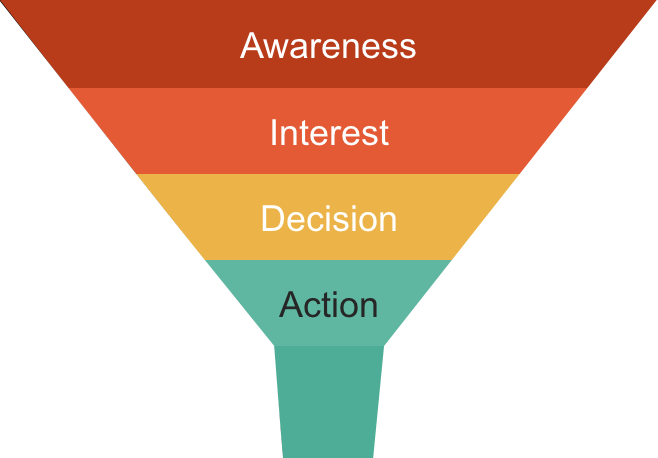
The Marketing Funnel is a tool to visualize the path a buyer or prospect takes as they become familiar with your company, from introduction to conversion (responding to a call to action) to becoming a customer (hopefully).
A funnel visual is used because a prospect either descends into the next stage of the funnel when their interest increases or they exit the funnel when they lose interest. A large number of prospects may enter the funnel, and eventually fewer end up purchasing which is why the funnel is wider at the top.
(SIMPLE MARKETING FUNNEL GRAPHIC)
The graphic below highlights many of the more popular metrics:
(31 FUNNEL METRICS GRAPHIC)
There are six core Marketing Funnel metrics categories within most B2B marketing organizations.
Top-of-Funnel Metrics
Prospect behavior (email bounce rates, impressions, average time on site, and web traffic) are measured by top-of-funnel metrics. These metrics have limited impact on lead-stage decisions and the bottom-line results found at the bottom of the funnel.
Middle-of-Funnel Metrics
Middle-of-the-funnel metrics also show prospect behavior (open rates, lead volumes, lead scores, conversion rates, and click-through rates), but are tied to a more important prospect action (filling out a form as opposed to merely viewing a webpage, for instance). These metrics can answer questions like, “How many leads did this campaign generate?” However, they can’t answer questions like, “How much revenue did this campaign generate the past 12 months?” or, “What were the opportunity conversion rates of this ad campaign?” These questions are answered at the bottom-of-the-funnel.
Bottom-of-Funnel Metrics
Bottom-of-the-funnel metrics are the most effective to measure marketing performance at the opportunity and customer stages. These metrics show revenue (at the opportunity and customer level) impact and guide campaign optimization and improvement decisions throughout the funnel. These are the metrics that matter most in the funnel.
Volume-Based Metrics
Volume-based metrics show magnitude and trends, but they rarely show a relationship to other relevant data, so they lack perspective which makes them difficult to support conclusions. Thus, they have limited use in supporting strategic decisions.
Cost-Based Metrics
Cost-base metrics such as “Cost-per-click (or lead, conversion, meeting, etc.) are popular with B2B marketing leaders as they can compare marketing spend with results from specific marketing activities, campaigns, or channels.
Percentage-Based Metrics
Percentage-based metrics (e.g. open rate, click-through rate, conversion rate, win rate, etc.) are popular and used to compare volumes such as, conversion rate of people who register for a webinar versus those that visited the webinar promotion page. Bottom-of-the funnel percentage-base-metrics, for example, are more valuable in decision making versus those from top-of-the funnel.
Our marketing and lead optimization frameworks focus heavily on identifying, tracking and managing metrics that matter, via existing marketing technology tools or through the integration of multiple data sources through data visualization tools such as Tableau or Microsoft Power BI.